
Imagine starting your day with a dashboard full of numbers. Calls. Response times. Pipeline. Customer satisfaction. Sales activities. Team goals. Your own results.
Everything is there. Still, nothing really happens.
Data does not create value on its own. It only does when people understand it, use it and act on it. That is why a good dashboard is not just about showing numbers in a nice way. It is about making it easier to see what is happening, what needs attention and where the team should take action.
In contact centers and service organisations, this matters even more. Performance changes all the time, and decisions often need to be made quickly. When numbers become visible in everyday work, they become an active part of how the team works.
What does data to action mean in practice?
Data to action is really about making numbers useful.
It means that KPIs are not hidden away in a system or left inside a report that someone reads later. Instead, they are shown in a way that both managers and employees can understand right away.
A good dashboard can show if response times are increasing, if the team is close to today’s target or if a campaign is performing better than expected. It becomes easier to react while it still matters.
Visible dashboards also create a shared language. When everyone can see the same numbers, it becomes easier to talk about performance without guessing. Follow-up becomes more concrete and decisions become more precise.
Why dashboards make numbers easier to use
A dashboard brings the most important information together in one place. It sounds simple, but it makes a big difference.
Instead of jumping between systems, spreadsheets and reports, the team can get an overview in seconds. Information becomes more accessible and, when something is easy to understand, it is also easier to use.
That is why dashboards work especially well in fast-paced environments. A team does not need to wait for a status update. They can follow progress live throughout the day. The manager can see where support is needed, the employee can see their own progress and the whole team can see how close they are to the goal.
In short, numbers become less technical and more human.
From overview to motivation
When numbers become visible, something happens to motivation.
A goal that used to sit in a spreadsheet suddenly becomes something the team can follow. An improvement becomes visible. A success gets noticed. Even a small step forward can create energy for the next one.
This is where dashboards can do more than inform. A leaderboard can show progress during the day, a notification can mark when an employee closes an important case and a team dashboard can bring everyone together around a shared target. Performance is not just something you measure; it becomes something you experience.
Visible performance also creates more ownership. When employees can see their own results, it becomes easier to understand how their work affects the bigger picture.
Choose the right numbers, not as many as possible
A good dashboard is not about showing everything. Too many numbers can quickly create noise. If everything is important, it becomes hard to see what actually needs action.
It is better to choose a few relevant KPIs that fit the team’s goals and daily work. In a contact center, this could be response times, customer satisfaction, solved cases, call volume or sales performance. In a sales team, it could be pipeline, meetings, conversions or new opportunities.
The most important thing is that the numbers can be used for something. If a dashboard helps the team react, prioritise and improve, it creates real value.
How we work with it in IntraManager
At IntraManager, we work every day to make data more visible, easier to understand and more useful.
With IntraManager, companies can bring information from multiple systems together and visualise it live on dashboards. This could be data from telephony, CRM, support systems, sales tools or other platforms.
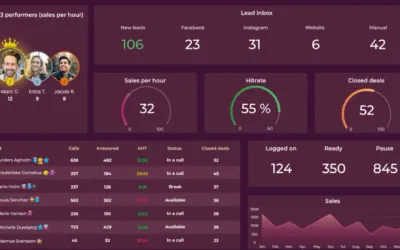
The information can be shown on TV screens, personal dashboards and team dashboards. Managers get a clear overview, employees get insight into their own performance and teams get something shared to gather around.
IntraManager can also be combined with gamification, notifications and achievements, so results are not only shown but also noticed. That makes data more alive in everyday work and helps teams stay focused on what matters most.
Make data part of everyday work
Data to action is not about having more numbers. It is about using the right ones better.
When information is shown clearly, live and in the right context, it becomes easier to understand. When it is easier to understand, it becomes easier to act on. And when teams act on what they see, dashboards really start to create value.
It is not the dashboard itself that makes the difference. It is what people do with it.